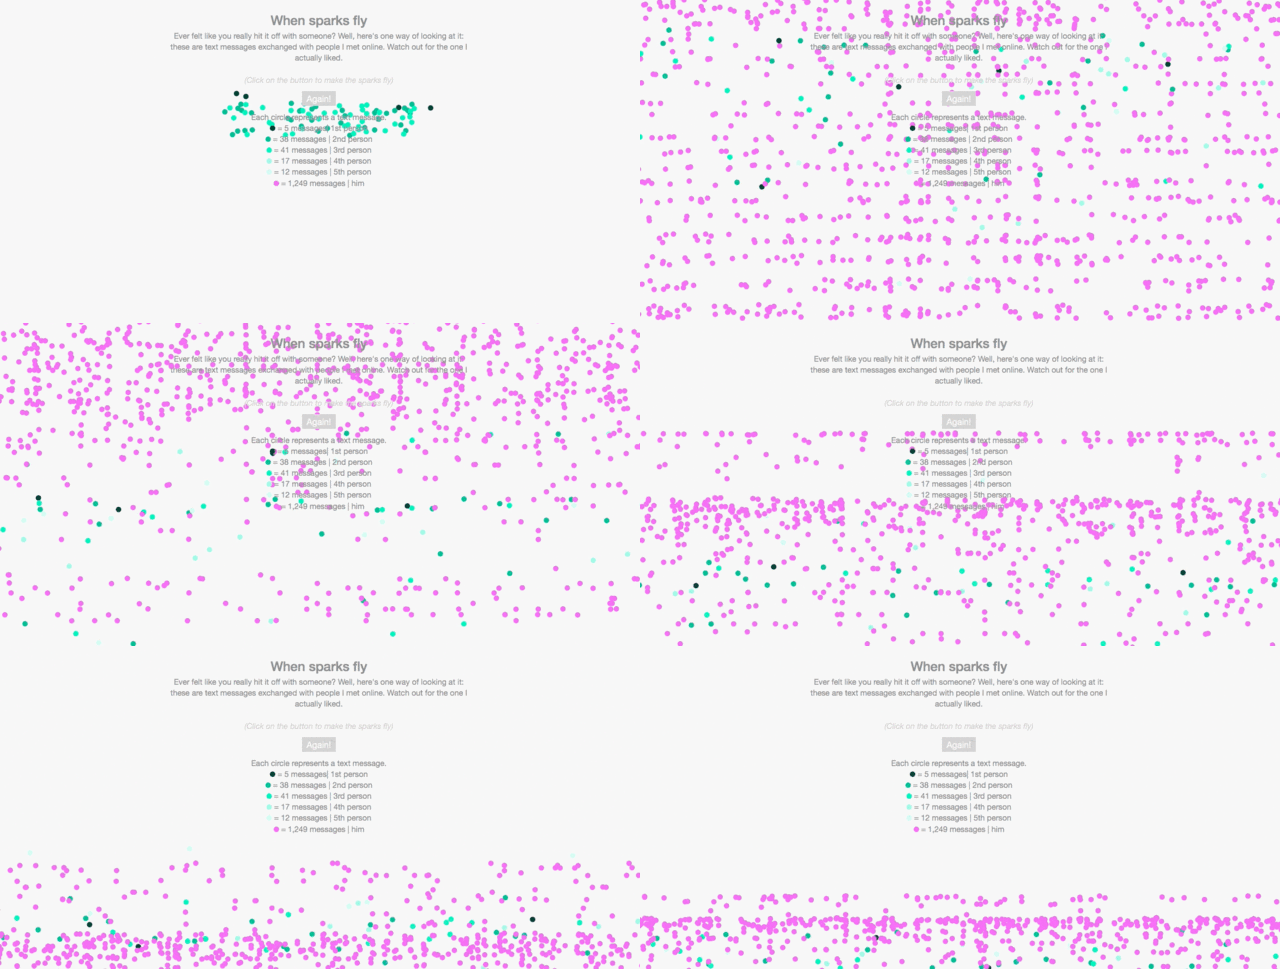
With apps like Tinder, dating in the online age can often feel like throwing a bunch of random balls into the air and then trying to juggle them at once. To visualize her recent dating history, multimedia reporter Lam Thuy Vo took that metaphor and ran with it, showing how all of those balls thrown into the air ended up working out for her.
In Lam's data viz, each text message sent to one of the six people she has dated recently is represented by a single color-coded ball. As soon as the balls are thrown into the air--there are more than 1,300 of them, all told--you can see at a glance how much each guy meant to her. By the time the balls have all settled to the bottom of the screen, the winner of her affections has completely drowned out the others in a gently undulating pool of sent love texts.

It's a fantastic visualization, no surprise, given Lam's pedigree as the interactive editor for Al Jazeera America (previously multimedia producer for NPR's Planet Money). More to the point, it shows that the numbers behind any set of data can be visualized and turned into a story. Or, in this case, the oldest story: a girl meeting a boy and falling in love.
Check out Lam's visualization here.