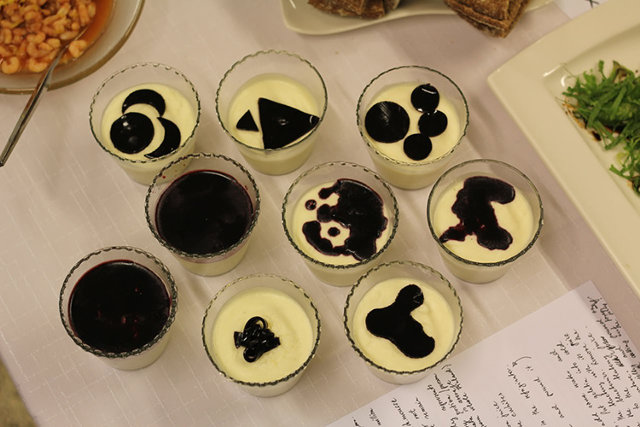
It would be fair to say that visualization maestro Moritz Stefaner eats up data. Over the years, he has used data for everything from identifying the world's selfiest cities to showing the hidden network stringing together the world's scientific institutions.
It was probably only a matter of time before Stefaner made his consumption of data literal. Stefaner is now exploring a new frontier in data viz. It's called Data Cuisine, and it's all about cooking up infographics that you can literally eat: a pizza that conveys the patterns of 100 years of Italian immigration, for example, or a salmon mousse that explores the environmental impacts of commercial fishing over the past decade.

The Data Cuisine project started in 2011, when cultural curator Susanne Jaschko approached Stefaner with the idea of mapping data patterns to food. Stefaner was immediately intrigued by the possibilities.
"I usually visualize data using colors, shapes, and form, but food opens up another dimension," Stefaner tells Co.Design. "The reasons we eat food are usually because we're hungry or we want to feel pleasure. We wanted to see whether or not food could also communicate data."
Since then, Jaschko and Stefaner have held two workshops, in Helsinki and Barcelona. They invited students to work with both a chef and a local data expert to turn their visualizations into Data Cuisine.

Properly done, Data Cuisine isn't meant to be a matter of just using a meal's surface appearance to "paint" a visualization. Rather, the taste, smell, and texture of the dish itself should be used as primary visualization tools and are every bit as important as the dish's appearance.
"When you think about it, all the different smells and textures and ingredients in a dish already mean something to us," Stefaner says. We each have mental associations with our food: The smell of curry might remind you of India, while the taste of cinnamon sugar might transport you back into your grandmother's kitchen. Food comes with a lot of associations for us, besides just the way it looks, so Data Cuisine uses our full palette of culinary associations to get its visualizations across. "The concept works best if the actual experience of eating is what makes your point," he explains.
Jaschko offers a good example of this principle in action: a lasagna that was made during the Helsinki workshop, called "Spiced Foreigners Between Pasta." The dish visualizes the increase in ethnic diversity in Finland: From left to right, each bite gets spicier, showing how immigration has diversified what was (not too long ago) formerly a bland and homogenous country.

In Barcelona, a data-visualizing gourmet who was upset about cuts to the nation's science funding, baked two traditional Spanish almond cakes, or Tarta de Santiago. One "non-science" cake was made with 34% less sugar than the other, representing the exact percentage of funding that has been cut from Spain's science budget in the past two years. The other cake was (naturally) sweeter, and because it was prepared using a number of scientific techniques (such as foaming the dough with a siphon or microwaving it for 45 seconds), it looked and tasted better, too.
Which brings up another central tenet of Data Cuisine: As long as it doesn't make you sick, anything goes. "Edibility is entirely optional," Jaschko says, laughing. "In Finland, for example, someone visualized the relationship between alcoholism and suicide rates as a Suicide Cocktail. It tasted awful, but if it tasted good, it wouldn't make any sense."
Data Cuisine might seem like a novelty, but Stefaner thinks Data Cuisine has one big advantage that traditional data viz doesn't: intimacy with the data itself. "If you eat something, you get a much deeper connection than if you just see it," Stefaner asserts. Eat a layered Russian salad in which the stacked ingredients reflect Finland's 2011 crime rates, Stefaner says, and you'll never forget those statistics again.